
Aside from the occasional somatic mutation, the genome of every cell in an individual’s body is largely preserved. Yet different types of cells (and tissues, and organs) are incredibly diverse. The majority of that specialization is governed by epigenetic changes — histone modifications, DNA accessibility, and methylation — that influence when and how genes are expressed.
Our knowledge of the epigenome has lagged well behind our knowledge of the genome, partly because it’s been difficult to study. The application of next-gen sequencing to RNA libraries (RNA-Seq), chromatin immunoprecipitates (CHiP-Seq), bisulfite-treated DNA, and regions of open chromatin (DNAse-Seq) makes it possible to interrogate many aspects of the genome in high-throughput fashion.
The NIH Roadmap Epigenomics Consortium has just published the largest collection of epigenomes characterized to date: 111 primary human tissues and cells profiled for histone modification patterns, DNA accessibility, DNA methylation, and gene expression. The 2,805 genome-wide datasets comprise 150.2 billion sequencing reads, equivalent to 3,174x coverage of the human genome. The findings, published in a slew of Nature papers earlier this year, provide remarkable insights into the complexity of the human epigenome.
Chromatin States from 5 Core Histone Marks
The authors first generated a common set of chromatin states across 127 epigenomes (111 of their own, and 16 more borrowed from ENCODE), all of which had been profiled for five core histone marks. These are somewhat confusingly named, but all of them indicate the addition of a methyl group (me) to a specific lysine residue (K) of histone H3, a key component of the nucleosome that undergoes various post-translation modifications. In any given cell, certain chromatin states tend to be marked with specific histone modifications:
- Enhancer and promoter regions are marked with single or tri-methylation of lysine 4 (H3K4me1 or H3K4me3), respectively.
- Transcribed regions are marked with tri-methylation of lysine 36 (H3K36me3)
- Polycomb-repressed regions are marked with tri-methylation of lysine 27 (H3K27me3)
- Tightly-packed heterochromatin is marked with tri-methylation of lysine 9 (H3K9me3).
Using the five core histone methylation marks I’ve just described, the authors trained a chromatin state model that classified every region into one of 15 states:
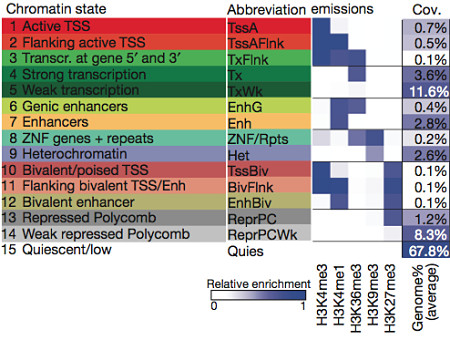
15 Chromatin States (Roadmap Epigenomics Consortium, Nature 2015)
Each state has a characteristic histone pattern and can be roughly classified as either active (the first 8) or repressed. Looking at coverage, we can see that for any given epigenome, the majority of bases (68%) lack any histone marks, suggesting a quiescent (low activity) state. However, a significant fraction bore marks of active chromatin, including ~5% that appear to be active promoters or enhancers. Another important histone modification is acetylation (ac), which is the addition of an acetyl group to a lysine residue. A subset of the epigenomes were therefore profiled for H3K27ac and H3K9ac, which mark increased activation of enhancer and promoter regions.
Patterns of Chromatin States
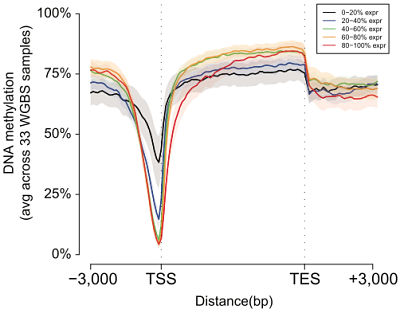
DNA methylation around genes (REC, Nature 2015)
Next, the authors turned to their other epigenomic profiling datasets — DNA accessibility (DNAse-Seq), methlation (bisulfite sequencing), and RNA transcription (RNA-Seq) to examine and compare the properties of these chromatin states. Consistent with previous studies, they found that:
- Promoter states showed low DNA methylation and high accessibility
- Transcribed states showed high DNA methylation and low accessibility
- Enhancers showed intermediate DNA methylation and accessibility
Genes proximal to H3K27ac-marked enhancers showed significantly higher transcription, supporting the idea that enhancers act as local (cis) regulators of gene expression.
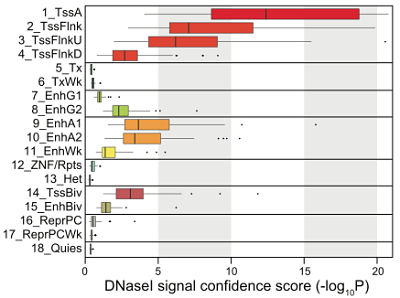
DNA accessibility by state (REC, Nature 2015)
Chromatin states sometimes predicted differences in RNA expression that weren’t captured by DNA methylation or accessibility measurements. For example, both enhancer (enh) and polycomb-repressed (repPC) states show intermediate levels of methylation (50-75%), but enhancers were more accessible and had more RNA transcription.
The Importance of Enhancers
Looking across all reference epigenomes, about 2.3 million regions (12.6% of the genome) showed evidence of promoter or enhancer activity in at least one cell or tissue type. These two states were enriched for non-exonic, evolutionary conserved regions. They also remained consistent across various cell types, except for a small subset that appeared to switch between promoter and enhancer states.
Enhancers that showed similar activity levels across cell/tissue types were enriched for similar gene functions and GWAS hits, suggesting that they may represent “coordinately regulated modules.” The sequences of these enhancers were enriched for many of the same transcription factor (TF) binding motifs; the authors could propose upstream regulators for about half of the enhancer modules they observed.
There were also many enhancers that showed tissue-specific activity. These were enriched for genes known to have tissue-specific expression. When the authors looked at disease-associated variants from the GWAS catalog, there were 58 studies with significant enrichment for certain tissue types. Many of these were in fact tissues known to be relevant for the disease. For example, several immune diseases (rheumatoid arthritis, lupus, coeliac disease, etc) were enriched for immune cell enhancers.
Epigenomes on the Map
There is much, much more to this study than I could hope to cover in one post, and that doesn’t begin to address the dozen or so companion papers that came out at the same time. The epigenome appears to be just as intricate and variable as the genome. Studying it will undoubtedly help us better understand how a deceptively simple genetic code provides the instructions for incredibly complex human beings.
References
Roadmap Epigenomics Consortium, Kundaje A, Meuleman W, Ernst J, Bilenky M, Yen A, Heravi-Moussavi A, Kheradpour P, Zhang Z, Wang J, Ziller MJ, Amin V, Whitaker JW, Schultz MD, Ward LD, Sarkar A, Quon G, Sandstrom RS, Eaton ML, Wu YC, Pfenning AR, Wang X, Claussnitzer M, Liu Y, Coarfa C, Harris RA, Shoresh N, Epstein CB, Gjoneska E, Leung D, Xie W, Hawkins RD, Lister R, Hong C, Gascard P, Mungall AJ, Moore R, Chuah E, Tam A, Canfield TK, Hansen RS, Kaul R, Sabo PJ, Bansal MS, Carles A, Dixon JR, Farh KH, Feizi S, Karlic R, Kim AR, Kulkarni A, Li D, Lowdon R, Elliott G, Mercer TR, Neph SJ, Onuchic V, Polak P, Rajagopal N, Ray P, Sallari RC, Siebenthall KT, Sinnott-Armstrong NA, Stevens M, Thurman RE, Wu J, Zhang B, Zhou X, Beaudet AE, Boyer LA, De Jager PL, Farnham PJ, Fisher SJ, Haussler D, Jones SJ, Li W, Marra MA, McManus MT, Sunyaev S, Thomson JA, Tlsty TD, Tsai LH, Wang W, Waterland RA, Zhang MQ, Chadwick LH, Bernstein BE, Costello JF, Ecker JR, Hirst M, Meissner A, Milosavljevic A, Ren B, Stamatoyannopoulos JA, Wang T, & Kellis M (2015). Integrative analysis of 111 reference human epigenomes. Nature, 518 (7539), 317-30